Resources
Marketing Dashboard Architecture: Tracking Media Spend to Closed Revenue
Most executive dashboards deliver data volume instead of decision clarity. When reporting focuses on platform-reported clicks and cost-per-lead, leadership loses sight of true customer acquisition costs and net margin. A durable marketing dashboard eliminates vanity metrics by tying every deployed dollar to first-party intake records, pipeline progression, and realized revenue.
By Mike Hulick, Founder, Marketing Powered

Why traditional marketing reporting fails the executive test
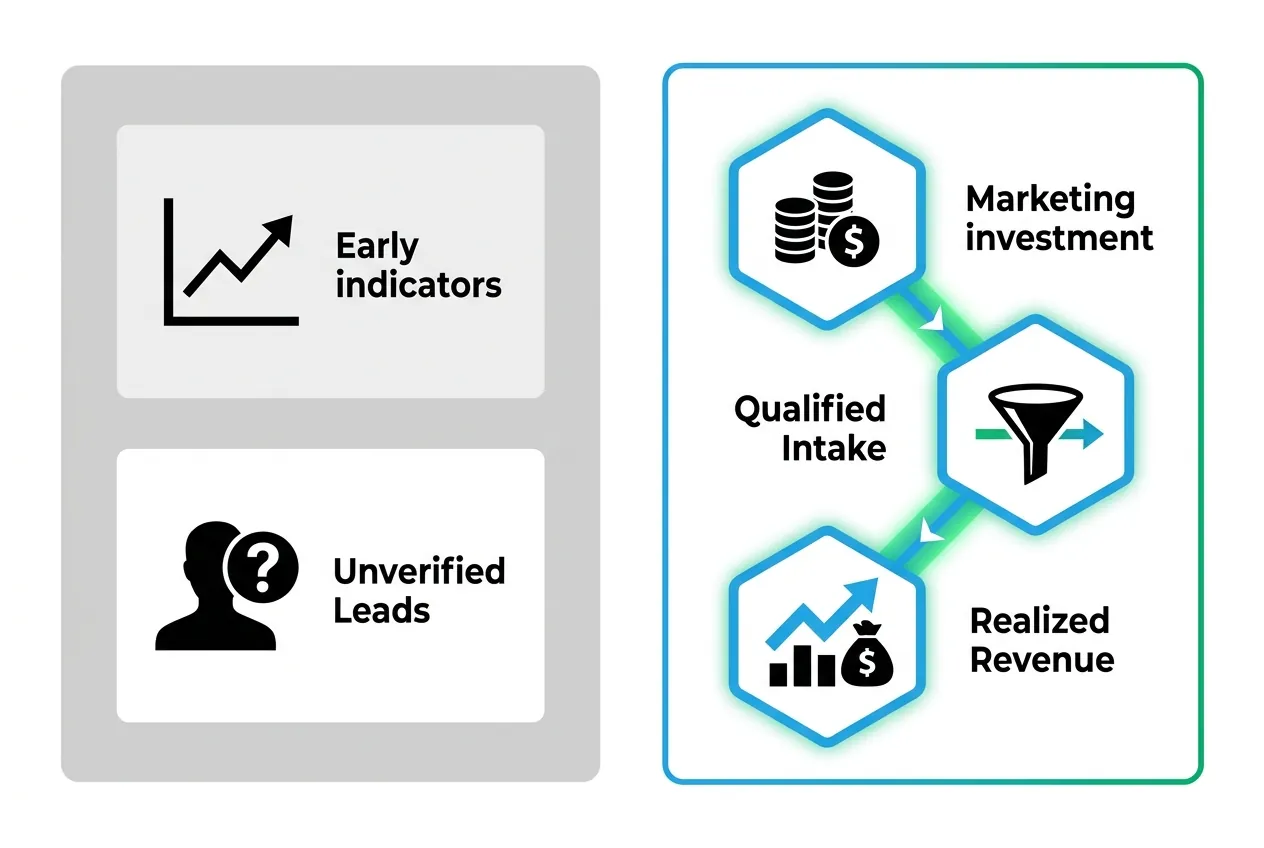
What is a marketing dashboard when built for executive governance?
A marketing dashboard is a centralized governance engine designed to evaluate capital efficiency, diagnose operational friction, and forecast pipeline. For an executive team, a dashboard is not a tactical monitoring tool for reviewing keyword bids, ad copy iterations, or social impressions. Growth marketing operators and chief financial officers need to answer a single structural question: which marketing investments yield verified gross margin?
Tactical practitioner dashboards serve a valid operational purpose inside media accounts. Digital specialists monitor cost-per-click, impression share, bounce rate, and in-platform conversions to optimize ongoing ad auctions. Problems emerge when these operational figures migrate directly into leadership review meetings. When a marketing team presents Google Ads conversions alongside Meta Ads manager conversions, the reported totals frequently exceed total business sales receipts.
Executive governance requires a different reporting plane. The dashboard must bridge three distinct operational environments: front-end media channels, mid-funnel intake systems, and back-end accounting ledgers. It provides chief marketing officers, growth directors, and financial controllers with a unified source of truth. Rather than debating whose platform numbers are correct, leadership uses this interface to allocate capital toward the highest-performing service lines, geographic territories, and acquisition channels.
Standard marketing reporting relies heavily on platform self-attribution. In-platform reporting models from digital ad networks operate with commercial incentives to claim credit for as many transactions as possible. If a prospective buyer searches for an organization on Google, clicks an ad, browses a service page, leaves, encounters a retargeting display on another site, and subsequently calls a location, multiple advertising platforms claim full credit for that single inquiry.
This attribution overlap obscures true customer acquisition cost. In multi-location businesses, hospital systems, and professional service networks, relying on platform conversions distorts performance reporting. Ad engines optimize algorithms toward the lowest immediate cost-per-lead. This optimization frequently produces a surge of low-intent inquiries, spam submissions, or unqualified phone calls. The marketing team celebrates a declining cost-per-lead, while admissions staff or sales representatives spend their shifts filtering through leads that never convert into paying clients or admitted patients.
The challenge is magnified in regulated industries where third-party audience targeting faces strict technical and legal constraints. For example, under the Google Ads Policy on Personalized Advertising, advertisers cannot deploy remarketing lists, create interest-based custom audiences, or track user browsing behavior across health-sensitive categories. Organizations operating under these guidelines cannot rely on third-party tracking pixels to piece together fragmented consumer journeys. A durable reporting system must replace platform-level assumptions with authoritative first-party data capture that tracks prospects through authenticated intake milestones. For a complete review of full-funnel measurement strategy, read our comprehensive guide to marketing attribution.
The four-stage marketing performance dashboard framework
To establish an accountable measurement system, organizations must deploy a structured four-stage data model. This framework organizes data linearly, moving from outbound cash deployment through operational intake touchpoints to realized revenue.
Stage 1: Capital deployment
The first layer tracks gross cash deployed by channel, campaign, and operational location. It records daily spend across Google Ads, Meta, local directories, programmatic networks, and offline media buys. Rather than isolating ad spend in platform silos, this tier centralizes expenditures to monitor budget pacing against designated monthly and quarterly caps.
Stage 2: Intake and ingestion
The second layer captures the first verified contact point. It measures qualified phone calls, scheduled consultations, completed intake questionnaires, and direct web chats. Every inbound interaction is tied to a unique session identifier, campaign source, and geographic market using first-party infrastructure. Calls lasting under a defined threshold (such as 60 or 90 seconds) are categorized separately to prevent administrative calls or wrong numbers from inflating conversion counts.
Stage 3: Pipeline progression
The third layer tracks prospect movement through customer relationship management (CRM) and electronic health record (EHR) pipelines. It records whether a lead met basic criteria, completed an assessment, passed insurance verification, or attended a discovery meeting. By measuring conversion velocity and drop-off rates between stages, this tier reveals whether intake friction originates in lead intent or internal operational follow-up.
Stage 4: Realized revenue and margin
The final tier connects operational milestones directly to accounting records. For a hospital or treatment network, this milestone is a verified patient admission and collected reimbursement. For a professional service firm, it represents an executed contract and settled invoice. By anchoring reporting to ledger revenue, leadership determines actual customer acquisition costs and calculates gross margin contribution by channel.
Free Audit
Want a straight read on where your budget is leaking?
Core metrics by decision: balancing marketing ROI and unit economics
An effective marketing kpi dashboard avoids exhaustive data dumps. It isolates the specific metrics required to make recurring budget, staffing, and expansion decisions.
- Capital Allocation. Core Dashboard Metric: Marketing Efficiency Ratio (MER). Operational Formula: Gross Revenue / Total Marketing Spend. Executive Action: Scale or trim overall media budget.
- Channel Viability. Core Dashboard Metric: Customer Acquisition Cost (CAC). Operational Formula: Channel Spend / Verified Customers. Executive Action: Reallocate spend between platforms.
- Lead Quality. Core Dashboard Metric: Opportunity Qualification Rate. Operational Formula: Qualified Opportunities / Total Leads. Executive Action: Audit keyword intent and messaging.
- Intake Capacity. Core Dashboard Metric: First-Contact Resolution Rate. Operational Formula: Completed Intakes / Inbound Contacts. Executive Action: Adjust intake staffing and response times.
- Unit Profitability. Core Dashboard Metric: Marketing ROI by Service Line. Operational Formula: (Collected Margin - Spend) / Spend. Executive Action: Prioritize profitable operational capacity.
Ad platform dashboards prioritize return on ad spend (ROAS), which compares self-reported platform conversion value directly against ad spend. ROAS calculations inside ad managers frequently misstate commercial reality because they rely on unverified transaction values, double-count multi-channel touchpoints, and omit sales overhead.
Executives evaluate marketing roi through holistic unit economics. Blended Marketing Efficiency Ratio (MER) provides an aggregate sanity check by evaluating total company revenue against total marketing outlay. Meanwhile, channel-specific Customer Acquisition Cost (CAC) isolates the exact cost to secure a paying client or admitted patient through a designated source.
When evaluating multi-location facilities, tracking CAC by location is mandatory. Aggregating data across a network can obscure a high-performing facility carrying the losses of an underperforming location with poor intake conversion rates. Evaluating local CAC empowers leadership to address operational bottlenecks at specific facilities rather than prematurely halting effective paid media campaigns.

Technical architecture: call tracking, CRM sync, and first-party ingestion
Delivering an executive dashboard that tracks from spend to revenue requires a connected technical architecture. If data silos exist between web analytics, telephony systems, and operational CRMs, leadership reporting breaks down.
First, dynamic number insertion (DNI) must be deployed across all web properties. When an individual lands on a site from a specific Google Search query, Meta campaign, or local listing, the system swaps the displayed phone number with a trackable forwarding number assigned to that visitor session. The telephony system records the call, duration, geographic origin, and session parameters, storing this record inside a centralized analytics repository. For teams evaluating telephony partners, review our guide to call tracking services.
Second, the architecture requires bi-directional synchronization between the web capture layer and the CRM. When an intake coordinator qualifies a prospect, schedules an appointment, or records an admission, that stage progression must write back to the centralized data warehouse. In healthcare and regulated environments, this pipeline must be engineered with explicit data handling boundaries. Patient health information (PHI) must be stored securely within HIPAA-aware systems, while de-identified conversion signals (such as a hashed identifier, timestamp, and stage milestone) are routed back to marketing systems to inform algorithmic bidding.
Third, data must be consolidated into an owned data warehouse rather than relying on live API connectors inside visualization tools. Querying multiple advertising APIs directly through dashboard front-ends causes broken visual widgets, missing historical records, and slow load times. An enterprise data warehouse ingests daily spend via scheduled pipelines, cleanses incoming data, joins ad spend to CRM records using unique tracking keys, and serves clean analytical tables to the executive interface.
Accountable data and analytics architecture with Marketing Powered
Marketing Powered builds data and analytics architecture designed for organizations operating in high-stakes, regulated environments. Our technical implementations connect top-of-funnel paid media campaigns directly to first-party intake systems, operational CRMs, and financial ledgers. We eliminate attribution blind spots, allowing executive leadership to govern capital allocation using verified business metrics rather than platform estimates. Learn more about our specialized approach to data and analytics architecture.
Our measurement frameworks reflect deep operational experience. Our founder is a former healthcare Chief Marketing Officer who led marketing for a treatment network that expanded from 3 to 24 locations, personally managed $1.5M to $2M per month in Google Ads across 11+ behavioral and mental health accounts, and serves as a court-certified expert witness in advertising strategy. We understand the regulatory constraints, data sovereignty requirements, and intake nuances of multi-location healthcare and professional services.
Marketing Powered has been AI-native since 2022, deploying owned, local AI infrastructure for HIPAA-aware inference. We engineer closed, sovereign data workflows that process and analyze intake records, operational data, and marketing pipelines without transmitting sensitive information to third-party public clouds. We maintain strict LegitScript and HIPAA awareness, developing attribution systems that measure downstream outcomes (such as patient admissions) even in sensitive healthcare verticals where ad retargeting is strictly prohibited. For organizations looking to audit their measurement foundations, we also outline what to expect when hiring an external partner in our guide to vetting a marketing attribution agency.
Questions, Answered.
A marketing dashboard is a dynamic, automated system updated in near-real-time to support continuous capital allocation, pipeline monitoring, and operational decisions. A marketing report is a static, periodic review (produced monthly or quarterly) that examines historical trends, documents post-campaign post-mortems, and provides high-level narrative context. Dashboards allow leadership to identify and fix performance bottlenecks during an active campaign, while reports document the finalized results after the campaign concludes.
A reliable executive marketing dashboard requires three architectural components: an ingestion layer, a storage warehouse, and a visualization interface. The ingestion layer collects data from ad platforms, call tracking software, and CRM systems. The storage warehouse reconciles and stores this unified data using strict data hygiene and deduplication rules. Finally, the visualization tool queries the warehouse to display clear, interactive charts for executive review.
Executive leadership should review high-level pacing, inbound lead volume, and operational intake metrics on a weekly basis to identify conversion leaks or budget pacing anomalies. Strategic metrics, such as fully loaded Customer Acquisition Cost (CAC), Marketing Efficiency Ratio (MER), and service-line profitability, should be evaluated monthly. This cadenced review cycle provides enough data volume for statistical reliability while allowing the team to adjust capital allocation before significant budget is wasted.
Healthcare organizations maintain strict regulatory compliance by separating marketing attribution identifiers from protected health information (PHI). First-party session parameters, call durations, and de-identified tracking identifiers are captured at the point of contact. Once a prospect enters the clinical intake or electronic health record (EHR) environment, PHI is kept within compliant, encrypted storage. Downstream milestones, such as a completed consultation or verified patient admission, are linked back to the analytics warehouse using de-identified record IDs, ensuring attribution tracking remains fully compliant with privacy requirements. Book an attribution audit with Marketing Powered
Ready to see where your marketing can improve?
Request a free audit of your paid media, landing pages, attribution, and measurement setup. You'll get a straight assessment of where the opportunities are.
or email us at info@marketingpowered.ai