Resources
Customer Acquisition Cost by Industry: Why Benchmarks Mislead and What to Measure
Executive leadership teams routinely evaluate customer acquisition cost by industry to determine whether their commercial spend is competitive, sustainable, and capital-efficient. Yet evaluating enterprise growth against blended, third-party benchmark tables often conceals the exact operational failures that inflate customer acquisition costs in the first place. Sustainable unit economics require assessing media and sales investments against gross margins, lifetime customer value, and intake response speed rather than unadjusted vertical averages.
By Mike Hulick, Founder, Marketing Powered

Why customer acquisition cost by industry benchmarks mislead executive teams
What is customer acquisition cost and how is it calculated?
At its simplest financial foundation, customer acquisition cost represents the total investment required to convince a prospective buyer to purchase a product or service. According to corporate accounting standards outlined by the Corporate Finance Institute Customer Acquisition Cost Guide, calculating true acquisition cost requires aggregating every direct and indirect expense incurred while generating pipeline and closing business over a specific measurement period, divided by the number of new customers acquired.
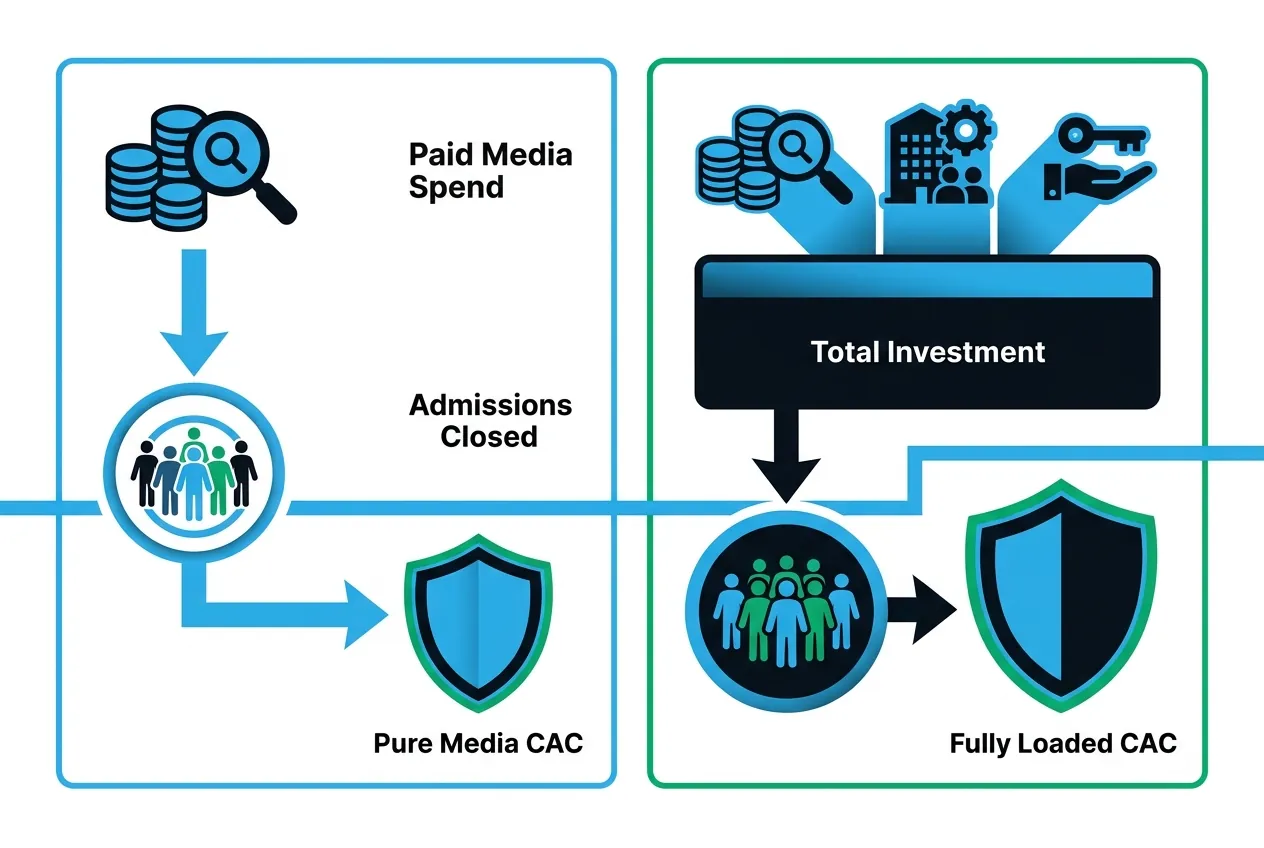
In high-consideration business models, healthcare networks, and complex professional services, evaluating marketing efficiency solely through front-end advertising spend produces an inaccurate picture. Finance teams and chief operating officers must distinguish between pure media CAC and fully loaded blended CAC.
Pure media CAC measures only direct advertising outlays on search engines and social platforms divided by acquired accounts. Fully loaded blended CAC includes paid media spend, agency retainers, intake personnel salaries, commissions, marketing automation software licensing, creative production costs, and CRM technical overhead.
A customer acquisition cost formula example
Consider a specialized outpatient healthcare network operating across regional markets. In a thirty-day financial close, the commercial ledger records the following expenditures:
- Paid search media spend: $60,000
- Intake coordination and contact center staff allocation: $18,000
- CRM, attribution software, and call tracking licenses: $4,000
- Creative production and landing page infrastructure: $3,000
- Total fully loaded commercial expenses: $85,000
During that same thirty-day window, the organization completes 85 clinical admissions directly attributable to those marketing investments.
Applying the customer acquisition cost formula example demonstrates the distinction:
- Front-end Media CAC: $60,000 / 85 admissions = $705.88 per admission
- Fully Loaded Blended CAC: $85,000 / 85 admissions = $1,000.00 per admission
If leadership calculates financial projections using only the front-end media figure, they understate their true cost of growth by almost 30%. In contrast to transactional direct-to-consumer commerce, where a shopper clicks an ad and completes an immediate checkout, regulated industries and professional service firms depend on multi-touch inquiry cycles. In these environments, phone calls, insurance verifications, clinical assessments, and consults sit between the initial click and the recorded transaction. Every operational step adds human cost and introduces pipeline friction.
Executive teams frequently encounter published reports detailing average customer acquisition costs categorized by sector: $350 for financial services, $900 for B2B technology, or $1,200 for specialized healthcare. Industry aggregators like the HubSpot Marketing Statistics Report compile figures across thousands of organizations. While these aggregate figures satisfy initial curiosity, relying on them to establish commercial budgets or evaluate marketing leadership is flawed.
Published benchmarks for customer acquisition cost by industry suffer from aggregation bias. These datasets combine early-stage organizations buying initial brand visibility with mature multi-location institutions leveraging decades of brand equity. A regional healthcare provider operating five facilities does not share the cost profile of a national hospital chain with established local referral networks, even though research reports place both within the same healthcare classification.
Second, generic benchmarks fail to normalize for regional competition and service specialization. A specialized neurology clinic or an intensive residential treatment provider faces vastly different competitive dynamics on search engines than a general family practice. Where search volume is limited and patient intent is high, auction-based cost-per-click rates rise dramatically.
Third, aggregate tables ignore differences in business model economics, contract duration, and revenue velocity. Consider two commercial B2B services providers operating within the exact same software-enabled services vertical:
- Company A sells an annualized contract valued at $6,000 with a 65% gross margin. Their average acquisition cost is $1,500.
- Company B sells an enterprise engagement valued at $45,000 with an 80% gross margin. Their average acquisition cost is also $1,500.
An executive reviewing an industry report showing an average vertical acquisition benchmark of $1,500 might conclude both companies operate with identical efficiency. In reality, Company A expends 25% of top-line contract value to acquire an account, while Company B invests just 3.3%. The benchmark provides zero insight into whether either company possesses a functional, scalable growth model.
What is a good customer acquisition cost? The LTV to CAC ratio
Instead of asking how an organization measures up against arbitrary cac benchmarks, executives should ask: what is a good customer acquisition cost relative to customer lifetime value and gross margin?
Customer lifetime value (LTV) represents the total gross profit an organization expects to realize from a single client account or patient relationship throughout its duration. The relationship between this return and the capital required to secure it forms the LTV to CAC ratio.
A widely accepted operational standard for healthy unit economics is an LTV:CAC ratio of 3:1. This means that for every dollar deployed in fully loaded acquisition costs, the organization extracts three dollars in gross margin over the life of that customer. An LTV:CAC ratio below 2:1 indicates an unstable commercial model where marketing and sales overhead consume available operating capital. Conversely, a ratio exceeding 5:1 often signals chronic underinvestment, where a business sacrifices market share by failing to deploy capital aggressively enough into qualified search demand.
Crucially, lifetime value must be calculated using gross profit margins rather than unadjusted gross revenue. If a healthcare provider or professional advisory firm collects $10,000 in average revenue per client but operates at a 40% direct gross margin, the realized gross profit is $4,000.
A customer acquisition cost example across two margin profiles
To understand how margin adjustments dictate acquisition targets, review this customer acquisition cost example comparing two distinct operational models:
- Scenario 1: Multi-Location Clinic Group
- Average Client Gross Revenue: $8,000
- Operating Gross Margin: 50%
- Realized Gross Profit (LTV): $4,000
- Maximum Target CAC for a 3:1 Ratio: $1,333
- Scenario 2: Specialized Advisory Practice
- Average Client Gross Revenue: $8,000
- Operating Gross Margin: 80%
- Realized Gross Profit (LTV): $6,400
- Maximum Target CAC for a 3:1 Ratio: $2,133
Both organizations command identical client contract sizes of $8,000. Yet the advisory firm can comfortably sustain an acquisition cost that is $800 higher per customer than the clinic group while maintaining the exact same return on invested capital. Executive planning that ignores gross margin in favor of generic customer acquisition cost by industry averages risks burning working capital on unsustainable campaigns.
Free Audit
Want a straight read on where your budget is leaking?
The intake and conversion leak: where acquisition costs actually inflate
When acquisition costs trend upward, marketing agencies and executive boards routinely point toward external variables: rising cost-per-click rates on Google Ads, increased competitor density, or macroeconomic contractions. While media market shifts do occur, the most common driver of inflated acquisition costs is operational friction inside the conversion and intake funnel.
Consider the operational journey of a high-intent prospect. A prospective patient, client, or corporate buyer executes a problem-specific search. They land on a marketing page. From that instant, the economic outcome of the media spend depends entirely on the technical conversion rate of that digital environment and the operational speed of the intake department.
If the landing page features generic copy, slow mobile load speeds, or disconnected intake forms, conversion rates drop from an achievable 12% to an anemic 3%. The cost per initial inquiry quadruples before a human conversation ever takes place.
Even when digital conversion environments perform cleanly, organizations regularly lose qualified demand within their intake workflow. If an inbound web inquiry waits ninety minutes for a telephone callback or an automated confirmation, contact rates decline precipitously.
In corporate intake environments where telephone inquiries are routed through multi-layered automated attendants, hold times exceed four minutes, or weekend inquiries sit unaddressed until Monday morning, realized customer acquisition costs soar. The front-end paid media campaign successfully captures the click, but the internal operational process fails to convert the opportunity into closed revenue.
Mathematically, if an intake team converts 30% of qualified inbound inquiries into scheduled appointments, and an operational breakdown drops that completion rate to 15%, the organization's effective customer acquisition cost doubles overnight. The ad spend did not become less efficient; the intake mechanism leaked half the acquired pipeline.

Systematic conversion optimization and the Marketing Powered approach
Marketing Powered addresses unit economics not by seeking cheaper ad clicks, but by re-engineering the conversion and intake infrastructure that receives paid demand. Treating conversion optimization as an isolated series of button-color experiments fails to move enterprise acquisition metrics. Meaningful reductions in unit cost require treating landing environments, messaging architecture, and CRM intake automation as an integrated conversion system.
This operational focus directly mirrors our structural experience. Marketing Powered was founded by a former healthcare CMO who ran marketing for a treatment network that grew from 3 to 24 locations, managing $1.5 to $2M per month in Google Ads across 11+ behavioral and mental health accounts. When scaling high-consideration operations under tight regulatory standards, media spend alone cannot compensate for a broken intake bridge.
Our methodology connects paid media directly to operational revenue by aligning message intent, technical landing page engineering, and immediate intake routing. In regulated and sensitive service categories, operational compliance is mandatory. Under the Google Ads Sensitive Categories Policy, traditional platform remarketing and retargeting lists are strictly prohibited for addiction treatment and behavioral health advertisers. Advertisers cannot rely on repetitive follow-up display banners to recover lost site visitors. Every campaign must achieve first-touch conversion precision.
Marketing Powered implements high-performance conversion environments structured around verified search intent. When an inquiry enters the system, automated intake workflows instantly route prospect data into CRM queues, triggering real-time contact protocols for intake teams. Attribution tracking is engineered to record performance through to final admission or closed contract rather than stopping at the raw form submission. By diagnosing and fixing the technical and procedural drop-offs between click, inquiry, and intake qualification, organizations systematically increase their realized pipeline volume and lower their effective acquisition cost.
To explore how these technical components are structured across enterprise funnels, review our comprehensive framework: Conversion rate optimization for lead generation: a system, not a list of tests. For teams evaluating external execution partners, our guides on choosing a Conversion rate optimization agency: what a specialist partner delivers and how to vet one and selecting a Landing page optimization agency: what a specialist partner delivers and how to vet one detail the necessary technical competencies.
Operational benchmarks to track instead of generic industry averages
Rather than benchmarking performance against generic cross-industry reports, leadership teams should measure five internal operational metrics. Tracking these variables provides diagnostic clarity into where capital is leaking and how to systematically lower acquisition expenses.
- Visitor-to-Inquiry Rate by Message Intent
Track how effectively individual landing pages convert paid clicks into inbound phone calls or digital form completions. Disaggregate this metric by search theme. If specific high-intent keyword groupings convert at 14% while broader exploratory terms convert at 2%, reallocate media budgets away from low-converting intent clusters.
- Intake Speed-to-First-Touch
Measure the exact elapsed time between a prospect submitting an inquiry and an intake specialist initiating contact. In high-intent services, responding within five minutes dramatically increases live contact and qualification rates compared to inquiries contacted after an hour. Measuring median response latency exposes bottlenecks in sales and intake operations.
- Qualified Inquiry-to-Opportunity Conversion Rate
Evaluate the percentage of inbound inquiries that meet established operational and financial criteria. If an agency reports a low cost-per-lead but only 10% of those inquiries qualify for services, the campaign is flooding intake queues with administrative noise, inflating fully loaded acquisition costs.
- Opportunity-to-Closed-Revenue Rate
Analyze the percentage of qualified opportunities that complete intake, sign contracts, or enter clinical care. Discrepancies between intake representatives or regional facilities often highlight training gaps, scheduling delays, or pricing friction rather than advertising failures.
- Payback Period Duration
Calculate the exact number of months required for an acquired customer's cumulative gross margin to fully reimburse the loaded cost of their acquisition. For enterprise sustainability, cash-efficient businesses generally target a payback window between six and twelve months. A rapid payback cycle preserves operating cash flow and allows organizations to reinvest in market expansion without external debt financing.
Questions, Answered.
Customer acquisition cost (CAC) is the total financial investment required to gain a new customer over a designated period. It includes all advertising outlays, marketing and sales team salaries, agency fees, software subscriptions, and operational intake expenses divided by the total number of customers acquired.
To calculate CAC accurately, add direct media spend to all supporting overhead, including intake staff compensation, software platforms, and creative asset development. Divide this total fully loaded figure by the number of closed customers or patient admissions generated within that timeframe. Avoid relying exclusively on front-end media spend, which distorts true economic performance.
While competitive keyword auction bidding raises front-end advertising costs, internal operational friction is usually the primary factor inflating customer acquisition costs. Unoptimized landing pages, slow intake response times, fragmented CRM handoffs, and poor phone answering rates reduce lead-to-customer conversion, causing organizations to spend substantially more media capital to achieve their target revenue volume.
Published industry benchmarks aggregate disparate companies with completely different operating margins, lifetime customer values, sales cycles, and pricing tiers into a single blended median. Comparing an organization's specific performance against an unadjusted national average obscures operational funnel health and provides inaccurate guidance for financial planning. Schedule a strategy call with Marketing Powered
Ready to see where your marketing can improve?
Request a free audit of your paid media, landing pages, attribution, and measurement setup. You'll get a straight assessment of where the opportunities are.
or email us at info@marketingpowered.ai