Resources
Healthcare Marketing Budget Allocation Across Locations
Healthcare marketing budget allocation by location is the operational process of distributing media capital across physical facilities based on clinical capacity, local market acquisition cost, and verified patient admissions. Rather than splitting budgets evenly or fixing spend to past revenue, multi-location healthcare systems must treat marketing capital as an elastic resource. Deploying funds where bed capacity is open, service lines are staffed, and qualified patient yield is proven prevents wasted spend in saturated facilities while driving sustainable census across the entire organization.
By Mike Hulick, Founder, Marketing Powered

The Operational Failure of Flat Splits and Fixed Revenue Percentages
Many healthcare networks manage multi-location marketing through administrative convenience rather than operational math. The two most common conventions are flat allocation, where every facility receives an identical monthly media stipend, and historical revenue indexing, where each site is awarded a fixed percentage of its prior quarter revenue. Both approaches disconnect marketing capital from physical facility realities.
Consider a multi-site network operating across distinct metropolitan and suburban markets. When corporate leadership mandates a flat monthly allocation of $15,000 per site, the capital deployment actively works against operational capacity. Facility A may sit in a dense metropolitan market with an established referral network, operating at 94% occupancy with a waitlist for residential beds. Facility B may be an outpatient facility launched six months prior in an adjacent region, staffed with licensed clinicians but operating at only 38% appointment utilization. Pouring equal media dollars into Facility A generates calls that clinical intake teams must turn away, while Facility B remains starved of the search impression share required to achieve operational break-even.
Fixed percentage-of-revenue models create an equally destructive trap. Under this model, high-earning, high-census facilities receive the largest marketing budgets simply because they generated revenue last month. Meanwhile, newer locations or facilities recovering from clinician turnover generate lower top-line revenue, which depresses their next marketing allocation. The facility that needs the most patient volume receives the least support, while the facility with zero open capacity receives an excess of paid inquiries.
Marketing capital must function as an operational balancing tool. Media investments should increase where margin, clinical bandwidth, and open beds exist, and contract where facilities have hit physical capacity or severe staffing constraints.

Core Operational Drivers of Location-Level Budget Allocation
Determining how much capital each facility warrants requires evaluating dynamic variables across operations, clinical capacity, and market-level unit economics. A modern health system marketing budget must reflect four operational variables:
1. Real-Time Clinical Capacity and Staffing Constraints
The fastest way to erode margin is advertising clinical services that cannot take new patients. When marketing teams operate in isolation from clinical scheduling systems, spend continues unabated during acute staffing shortages. If a facility loses two specialized therapists or faces an unexpected nurse vacancy, available appointments or bed days drop immediately. Budget allocation models must ingest weekly utilization data. When a service line or facility reaches 85% to 90% utilization, media dollars should automatically taper or route to secondary geographic territories with open capacity.
2. Local Payer Mix and Contribution Margin
A patient admission does not carry uniform enterprise value across geographic boundaries. Differences in regional commercial insurance contracts, in-network reimbursement rates, and Medicaid penetration dictate the gross margin profile of each site. Allocating equal patient acquisition budgets across locations with divergent reimbursement schedules leads to capital destruction. Markets with favorable commercial reimbursement can absorb higher acquisition costs while delivering strong contribution margins. Facilities operating in regions with heavily discounted payer contracts require strict acquisition cost caps to preserve operating margins.
3. Geographic Search Demand and Local Auction Density
Digital media costs vary dramatically by market. The cost per click for high-intent behavioral health or specialized hospital keywords in competitive urban centers can be three to five times higher than in suburban or secondary markets. Attempting to buy equal impression share across all markets with identical budgets produces fragmented reach in high-cost cities and over-saturation in rural areas. Budget models must account for localized cost per thousand impressions (CPM), local search volumes, and competitive density.
4. Downstream Intake Conversion Rates
Two identical clinics with identical media spend often yield vastly different census outcomes because of local intake performance. Differences in front-desk staffing, local intake coordinator responsiveness, and regional insurance verification speeds directly alter downstream conversion efficiency. Media spend should reward intake efficiency while operations addresses conversion bottlenecks at lagging facilities.
Regulatory Limits and Paid Media Constraints Across Markets
Multi-location healthcare campaigns cannot operate like conventional retail or multi-unit franchise advertising. Strict privacy frameworks, state-level regulations, and platform advertising policies govern how patient demand can be acquired and measured across physical sites.
The most critical operational constraint in digital healthcare acquisition is the complete prohibition of behavioral remarketing. Under the Google Ads Policy on Personalized Advertising, advertisers are barred from using sensitive personal health data, including medical conditions and treatment requirements, to create remarketing lists or target users based on past interactions. A regional facility cannot simply tag website visitors who abandoned an intake page and follow them around the web with display ads. Every dollar allocated to a location must win intent on the primary interaction through high-relevance search, local business listings, and clean landing page infrastructure.
Furthermore, addiction treatment and specialized behavioral health facilities face strict verification mandates. To run paid search campaigns across state lines, providers must navigate specialized certification standards outlined in the Google Ads Healthcare and Medicines Policy, including verification through LegitScript. Expanding a regional budget into a new location requires verified entity status, clean localized business licensing, and physical facility registration before campaigns can deploy.
Tracking architectures across multi-site networks must also adhere to federal privacy enforcement. The HHS Guidance on Tracking Technologies restricts the transmission of protected health information (PHI), including IP addresses combined with appointment requests or condition-specific page views, to third-party ad networks without proper authorization. Healthcare marketing leaders must build privacy-safe tracking environments that measure location-level acquisition while isolating sensitive patient data from public ad platform pixels.
Free Audit
Want a straight read on where your budget is leaking?
The Three-Tier Location Allocation Framework
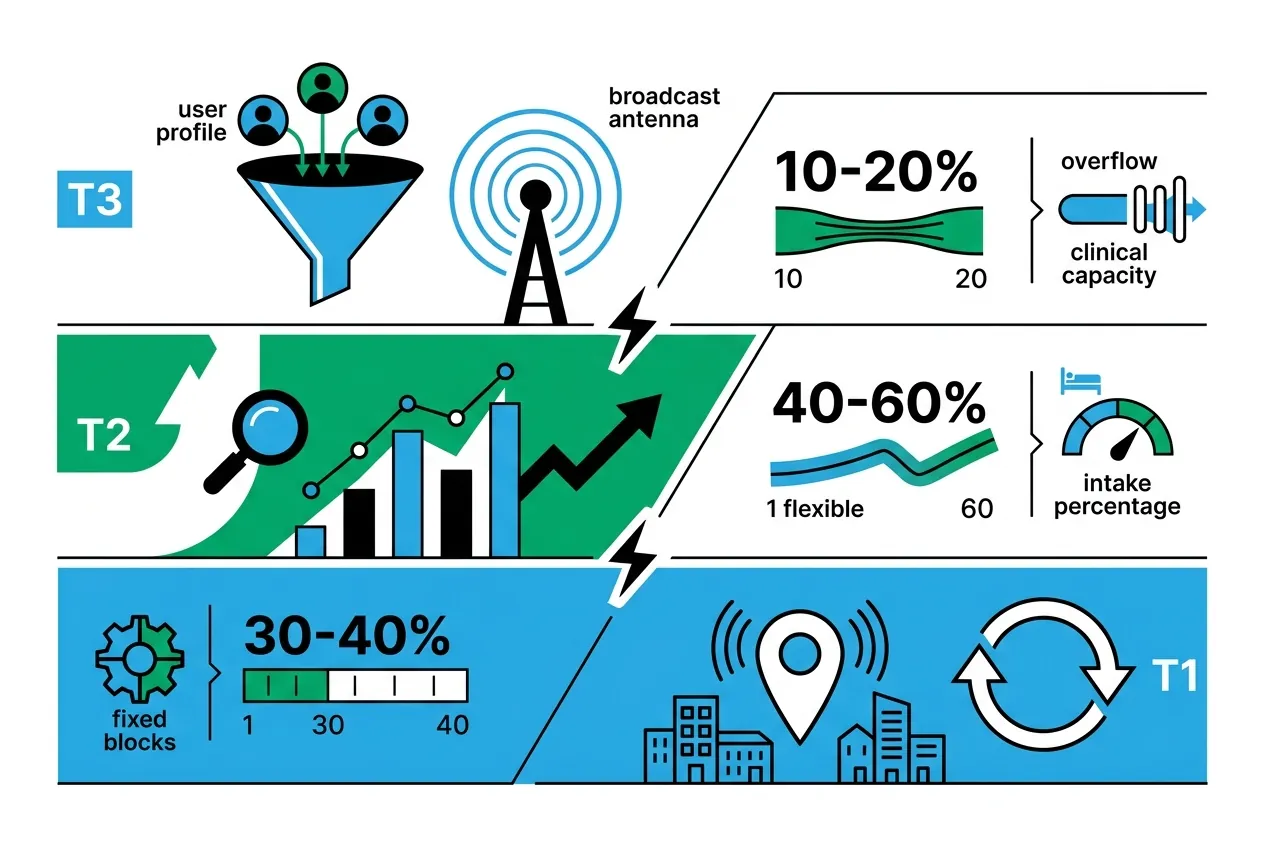
To avoid arbitrary allocations, healthcare systems should categorize local spending into three distinct tiers. This framework balances baseline market presence with responsive growth media:
Tier 1: Foundation Catchment Spend (Fixed Baseline)
Every physical location requires a permanent baseline budget to maintain ownership over its immediate geographic catchment area. This includes Google Business Profile management, local citation maintenance, local organic search optimization, and branded search defense.
Even if a hospital or residential facility sits at 98% occupancy, foundation media must remain active. If a healthcare provider fails to capture branded search queries within a 15-mile radius, competing facilities or third-party lead aggregator directories will bid on those terms, diverting local patient volume. Tier 1 spend is relatively static and typically represents 30% to 40% of a location total marketing allotment.
Tier 2: Elastic Search and Geo-Expansion (Dynamic Allocation)
Tier 2 represents the primary growth engine and the most flexible component of the marketing budget. This capital funds high-intent non-brand paid search, service-line campaigns, and localized social discovery. Tier 2 spend is not locked to historical averages; it expands or contracts weekly based on clinical capacity.
When Facility C reports an upcoming drop in inpatient census, Tier 2 media weight is increased. The media perimeter expands from the primary 10-mile radius to secondary 30-mile corridors, bidding aggressively on commercial-intent service terms. When beds fill, Tier 2 spend scales back, and capital reallocates to facilities with open clinical appointments. This tier accounts for 40% to 60% of total paid media investment.
Tier 3: Regional Demand Capture (Market Scale)
Tier 3 capital is deployed exclusively when a healthcare provider operates multiple facilities across a contiguous region with stabilized baseline utilization. It encompasses broader digital awareness, regional non-personalized social campaigns, and local sponsorship amplification. Tier 3 media targets upstream decision-makers, such as adult children seeking mental health care for parents or individuals exploring elective surgical care. Tier 3 spend is funded from corporate growth capital rather than facility-level operational budgets.
Measuring Patient Acquisition ROI Beyond the Initial Inquiry
The central flaw in traditional healthcare marketing attribution is optimizing campaigns around top-of-funnel conversion signals. Reporting on cost per click, cost per phone call, or cost per web form submission creates a distorted picture of marketing efficiency.
In healthcare, an inquiry is not a patient. A paid search campaign in one market might generate phone calls at $45 each, but if 80% of those callers carry out-of-network insurance, seek services the facility does not provide, or fail clinical screening, the effective cost per qualified intake escalates rapidly. Meanwhile, a campaign in an adjacent market might generate inquiries at $120 each, but with a 65% commercial insurance verification rate and an 80% show rate for clinical assessments.
Evaluating true patient acquisition ROI requires tracking media investments past the call center and directly into electronic health record (EHR) and customer relationship management (CRM) milestones. True performance must be measured on:
- Cost Per Qualified Intake (CPQI): Spend divided by callers who meet clinical criteria and hold accepted insurance coverage.
- Cost Per Attended Clinical Assessment (CPCA): Spend divided by individuals who arrive at the facility or complete a telehealth intake.
- Cost Per Verified Admission (CPVA): Spend divided by patients who physically admit to a bed or enroll in an active course of treatment.
- Contribution Margin Per Admission: Net collected revenue minus direct clinical delivery costs and patient acquisition cost.
Marketing Powered was built on this operational discipline. As an AI-native organization since 2022, led by a former healthcare CMO who ran marketing for a treatment network that grew from 3 to 24 locations and managed $1.5 to $2M per month in Google Ads across 11+ behavioral and mental health accounts, Marketing Powered implements attribution models tracked to admission, not just lead. By pairing owned, local AI infrastructure for HIPAA-aware inference with clean offline conversion tracking, multi-location healthcare systems can trace every dollar of media spend directly to verified clinical encounters.
To explore the reporting structures needed to capture these metrics, review our guide to multi-location healthcare reporting.
A Weekly Cadence for Shifting Budget Across Facilities
Healthcare marketing budget allocation by location cannot remain a quarterly or annual accounting exercise. Dynamic capital governance requires a structured weekly cadence connecting marketing leadership, financial controllers, and clinical operations.
Step 1: Monday Capacity and Staffing Audit
Every Monday morning, clinical operations submits an updated census dashboard showing current occupancy, projected discharges for the upcoming 14 days, and clinical staffing availability by service line for every physical location. Facilities with greater than 90% projected occupancy are flagged for media conservation; facilities with less than 75% occupancy are flagged for media expansion.
Step 2: Intake Verification and Quality Review
Marketing and admissions leadership review the preceding seven days of intake data. This review isolates the ratio of total calls to clinically qualified opportunities, accepted insurance rates, and scheduled assessments by site. If a location experienced an influx of unqualified calls, campaign keyword matching and geographic radii are tightened immediately.
Step 3: Capital Rebalancing and the 20% Shift Rule
Media controllers adjust location-level campaign budgets based on the combined census and qualification data. To maintain bidding stability within automated ad platform algorithms, budget shifts should adhere to the 15% to 20% rule. Moving more than 20% of an ad group or campaign budget in a single day can reset machine-learning bidding models into an extended learning phase, driving up localized acquisition costs. Budgets should be adjusted incrementally across a 72-hour window.
Step 4: Mid-Week Pacing and Auction Monitoring
By Thursday, media managers verify that reallocated funds are pacing correctly and that impression share in prioritized markets is expanding without excessive cost inflation. If a targeted market exhibits severe competitive bid spikes that depress return on investment, capital is shifted toward adjacent catchment territories or alternative service lines.
For a deeper analysis of financial modeling across clinical service lines, read our strategic breakdown on healthcare marketing ROI.

Email Us
Prefer to send the context directly?
Operational Checklist for Multi-Location Marketing Governance
Executing cross-location budget governance requires documented operating standards. Marketing leadership, clinical directors, and finance teams can use the following operational scorecard to assess cross-location alignment:
Clinical and Capacity Alignment
- Do marketing media controllers receive weekly facility-level census and staffing reports before setting campaign budgets?
- Are media spend caps established for locations operating above 90% bed or appointment capacity?
- Is there an operational process to pause localized service-line advertising within 24 hours of clinician departure or sudden bed shortages?
Media Architecture and Platform Compliance
- Are campaigns structured with clean geographic boundaries that prevent separate physical locations from competing against each other in the same ad auctions?
- Does the organization hold verified LegitScript certification and state-level advertising credentials for every target jurisdiction?
- Are all digital campaigns fully compliant with the prohibition on personalized remarketing in sensitive health verticals?
- Is web analytics infrastructure configured to prevent the transmission of protected health information to advertising platforms under federal tracking guidelines?
Attribution and Downstream Economics
- Can regional marketing directors view cost per verified admission and cost per attended clinical assessment alongside standard web metrics?
- Are localized budgets adjusted based on regional commercial payer mix and reimbursement profitability rather than top-of-funnel lead counts?
- Does corporate leadership review cross-location intake conversion rates to identify operational friction before adjusting media allocations?
Questions, Answered.
Baseline brand and catchment spend (Tier 1) should remain stable month over month to protect local search positioning. Elastic growth budgets (Tier 2) should be evaluated weekly and adjusted based on rolling 14-day clinical capacity forecasts, staffing levels, and verified intake volume. Shifting spend in increments of 15% to 20% preserves ad platform algorithm stability while responding to operational needs.
Flat distribution forces capital into facilities that lack the physical or clinical capacity to handle new patients, resulting in rejected inquiries and wasted ad spend. Simultaneously, it underfunds newer or expanding locations that require concentrated media weight to overcome local competitive barriers and reach break-even census.
Because advertisers cannot retarget individuals who browse sensitive medical or mental health pages, multi-location healthcare systems must secure qualified conversion on the initial interaction. This operational constraint requires investing capital into high-relevance search terms, localized landing pages, and friction-free intake call routing rather than relying on lower-cost retargeting funnels to capture lost prospects.
Lead metrics fail to account for clinical qualification, payer acceptance, and intake show rates. A facility generating low-cost inquiries dominated by unsupported insurance plans or out-of-catchment inquiries will show an attractive cost per lead while generating zero enterprise value. Measuring spend against verified admissions and attended encounters ensures media capital flows to campaigns that yield sustainable contribution margins. Request an acquisition audit
Ready to see where your marketing can improve?
Request a free audit of your paid media, landing pages, attribution, and measurement setup. You'll get a straight assessment of where the opportunities are.
or email us at info@marketingpowered.ai