Research
Meta Ads Benchmarks 2026: Original Research from Behavioral Health Campaigns
Original research from $50M+ in managed behavioral health and mental health media spend, with actionable data for treatment center marketers.
Introduction to Meta Ads Benchmarks 2026
Why accurate benchmark data determines whether your Meta spend generates admissions or burns budget
Meta ads benchmarks have shifted substantially since 2024. If you are running Facebook or Instagram advertising for a behavioral health organization, the numbers you used to plan last year's campaigns no longer reflect current market conditions. CPMs have increased. Competition for attention in the treatment vertical has intensified. And the platforms themselves have changed how they optimize delivery, meaning your historical performance data may be misleading you about what is actually achievable.
This study compiles performance data from behavioral health and mental health advertising campaigns managed by Marketing Powered across 2025 and into Q1 2026. The dataset draws from over $50M in managed behavioral health media spend, spanning addiction treatment, detox, residential programs, IOP/PHP, dual diagnosis, and adolescent treatment centers. We have tracked these campaigns from impression through admission, not just to the lead form.
The meta ads benchmarks presented here are not industry averages pulled from broad surveys. They are operator-level numbers from campaigns we have directly managed, with attribution tracked through to census impact. This distinction matters because most published Facebook ad benchmarks aggregate data across industries and campaign objectives that have nothing in common with treatment center marketing. A benchmark derived from e-commerce prospecting campaigns tells you nothing about what to expect when advertising residential addiction treatment to families in crisis.
The key performance indicators analyzed in this study include cost per click (CPC), click-through rate (CTR), cost per thousand impressions (CPM), cost per lead (CPL), cost per qualified lead, and cost per admission. We also examine platform-specific metrics like frequency, reach efficiency, and audience saturation rates that determine how long a campaign can run before performance degrades.
Understanding where your campaigns stand relative to these benchmarks allows you to diagnose underperformance, set realistic expectations for new campaigns, and make informed decisions about budget allocation across channels. The data that follows is structured to give you reference points for each stage of the funnel, from initial awareness through admission-qualified leads.
Cost Per Thousand Impressions (CPM) Benchmarks
What treatment center advertisers should expect to pay for Meta inventory in 2026
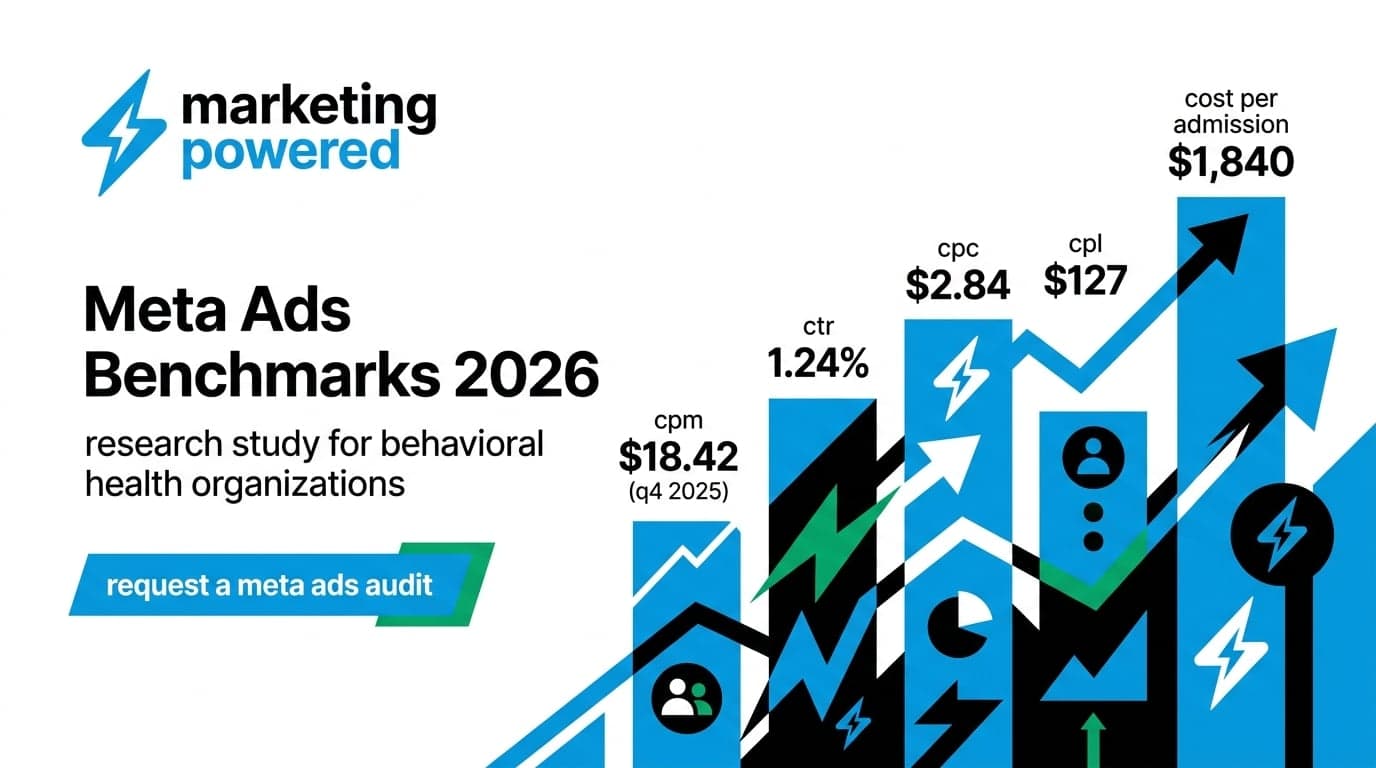
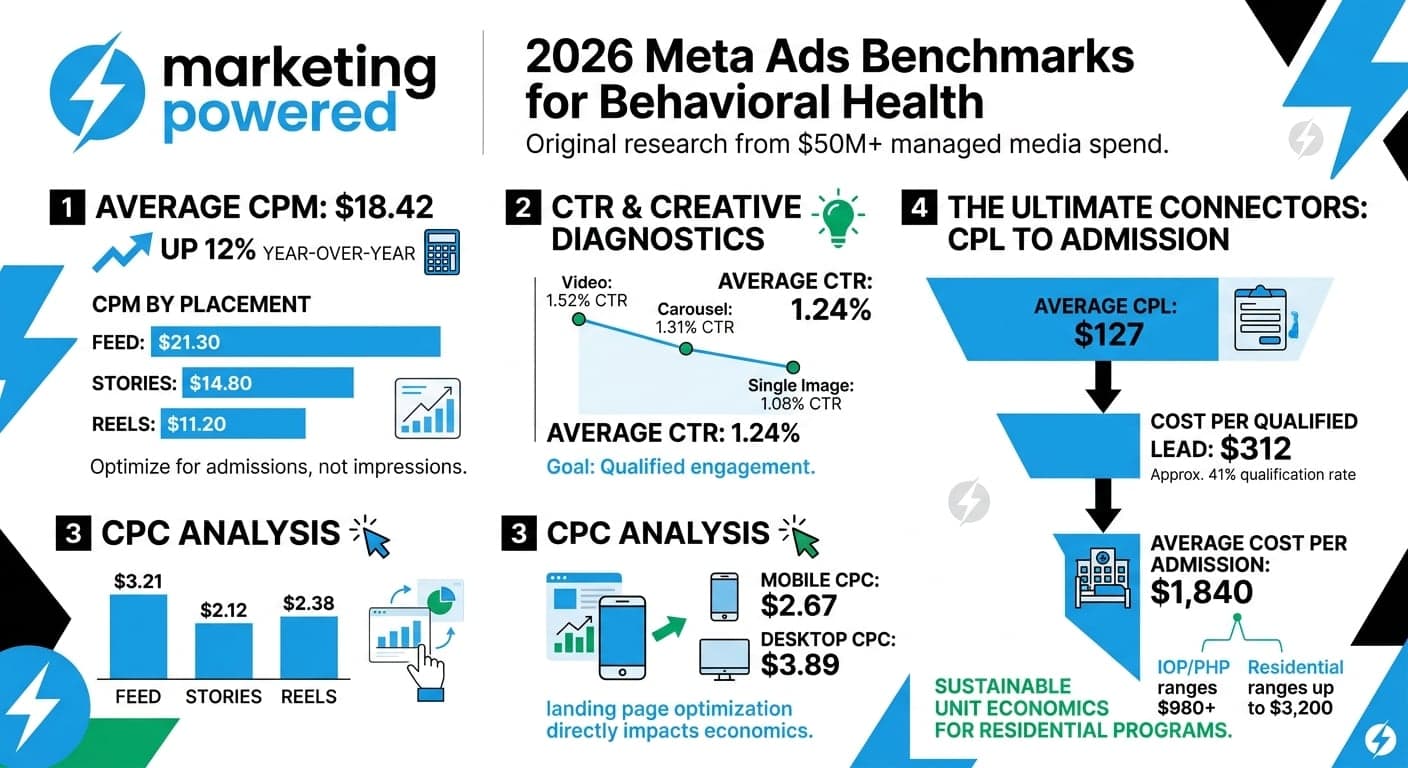
CPM for behavioral health campaigns on Meta averaged $18.42 in Q4 2025, up 12% from the same period in 2024. This increase reflects broader platform trends. Analysis of Meta advertising costs from Statista shows average CPMs across all verticals rose approximately 9% year-over-year as advertiser competition intensified.
Within behavioral health, CPM varies substantially by placement and objective. Feed placements (Facebook and Instagram combined) averaged $21.30, while Stories placements came in at $14.80. Reels placements showed the lowest CPMs at $11.20, though conversion rates from Reels were also lower, resulting in a higher cost per lead despite the cheaper impressions.
Geographic variation affects CPM as well. Campaigns targeting high-competition states like California, Florida, and Arizona showed CPMs 25-40% above the national average. This reflects both population density and the concentration of treatment centers competing for the same audiences in those markets.
Placement-level CPM data allows smarter budget allocation. Advertisers who concentrate their spend on Reels to chase low CPMs often find their cost per admission is higher than Feed-focused campaigns, because the conversion path from Reels requires more steps, and lower-intent users are more prevalent. Optimize for cost per admission, not cost per impression.
- Feed placements (Facebook + Instagram): $21.30 average CPM
- Stories placements: $14.80 average CPM
- Reels placements: $11.20 average CPM
- High-competition state markets: 25-40% above the national average
- Year-over-year CPM increase: 12% for behavioral health
Click-Through Rate (CTR) Benchmarks
How behavioral health CTR compares to platform averages and what drives performance
Average CTR for behavioral health lead generation campaigns was 1.24% in 2025, compared to the all-industry Meta average of approximately 0.90% reported by WordStream. This above-average CTR reflects the intent-driven nature of treatment search. When someone is looking for help for themselves or a family member, they are more likely to engage with relevant advertising.
CTR varied by creative format. Video ads achieved the highest CTR at 1.52%, followed by carousel ads at 1.31% and single image ads at 1.08%. The video performance advantage held across campaign types, though the production cost of video creative means the ROI advantage is not as large as the CTR gap suggests.
The audience targeting approach also influenced CTR. Broad targeting with creative-based qualification produced CTRs of 1.18%. Lookalike audiences based on admission data produced CTRs of 1.41%. Interest-based targeting, where still available for health-related topics, produced the highest CTRs at 1.58% but often at the cost of lead quality.
CTR is a useful creative diagnostic, but should not be the primary optimization target. High CTR with poor lead quality produces high CPL and poor cost per admission. The goal is qualified engagement, not raw clicks.
- All-format average CTR: 1.24%
- Video ads: 1.52% CTR
- Carousel ads: 1.31% CTR
- Single image ads: 1.08% CTR
- Lookalike audiences (admission-based): 1.41% CTR
- Broad targeting: 1.18% CTR
Free Audit
Want a straight read on where your budget is leaking?
Cost Per Click (CPC) Benchmarks
CPC by placement, format, and device for behavioral health campaigns
Average CPC for behavioral health campaigns was $2.84 in 2025. This represents the cost to generate a click to a landing page, not the cost of a lead or qualified opportunity. CPC is useful for diagnosing creative performance, but should not be the primary optimization metric for treatment center campaigns.
CPC by placement showed Stories delivering the lowest cost at $2.12, followed by Reels at $2.38, and Feed at $3.21. However, lead quality from Stories and Reels placements was generally lower, meaning the apparent CPC advantage often disappeared when measured at the cost per qualified lead level.
Mobile placements delivered lower CPCs ($2.67) than desktop ($3.89), which aligns with user behavior patterns on Meta platforms. Mobile dominates usage, giving the algorithm more inventory to optimize against.
The practical implication of CPC data is landing page selection and optimization. At $2.84 per click, a landing page converting at 3% produces a CPL of approximately $95. The same traffic with a 6% conversion rate produces a CPL of $47. Landing page optimization has a direct and immediate impact on campaign economics that creative optimization alone cannot match.
- Overall average CPC: $2.84
- Feed placement CPC: $3.21
- Stories placement CPC: $2.12
- Reels placement CPC: $2.38
- Mobile CPC: $2.67
- Desktop CPC: $3.89
Cost Per Lead (CPL) and Cost Per Admission Benchmarks
Strategy
Ready to map a growth plan built for your vertical?
The funnel metrics that connect Meta spend to census outcomes
This is where meta ads benchmarks become most relevant for treatment center operators. CPL tells you what you are paying to generate a form fill or call. Cost per admission tells you what you are actually paying to fill a bed.
The average CPL for behavioral health Meta campaigns was $127 in 2025. This includes all lead types: form submissions, instant form completions, and tracked calls from Meta ads. The range was wide, from $68 for campaigns targeting lower-acuity outpatient services to $245 for residential treatment campaigns in competitive markets.
Cost per qualified lead averaged $312. This qualification rate of approximately 41% from raw lead to qualified lead is typical for behavioral health, where many inquiries come from individuals who are not ready for treatment, do not have appropriate insurance, or are researching on behalf of someone else.
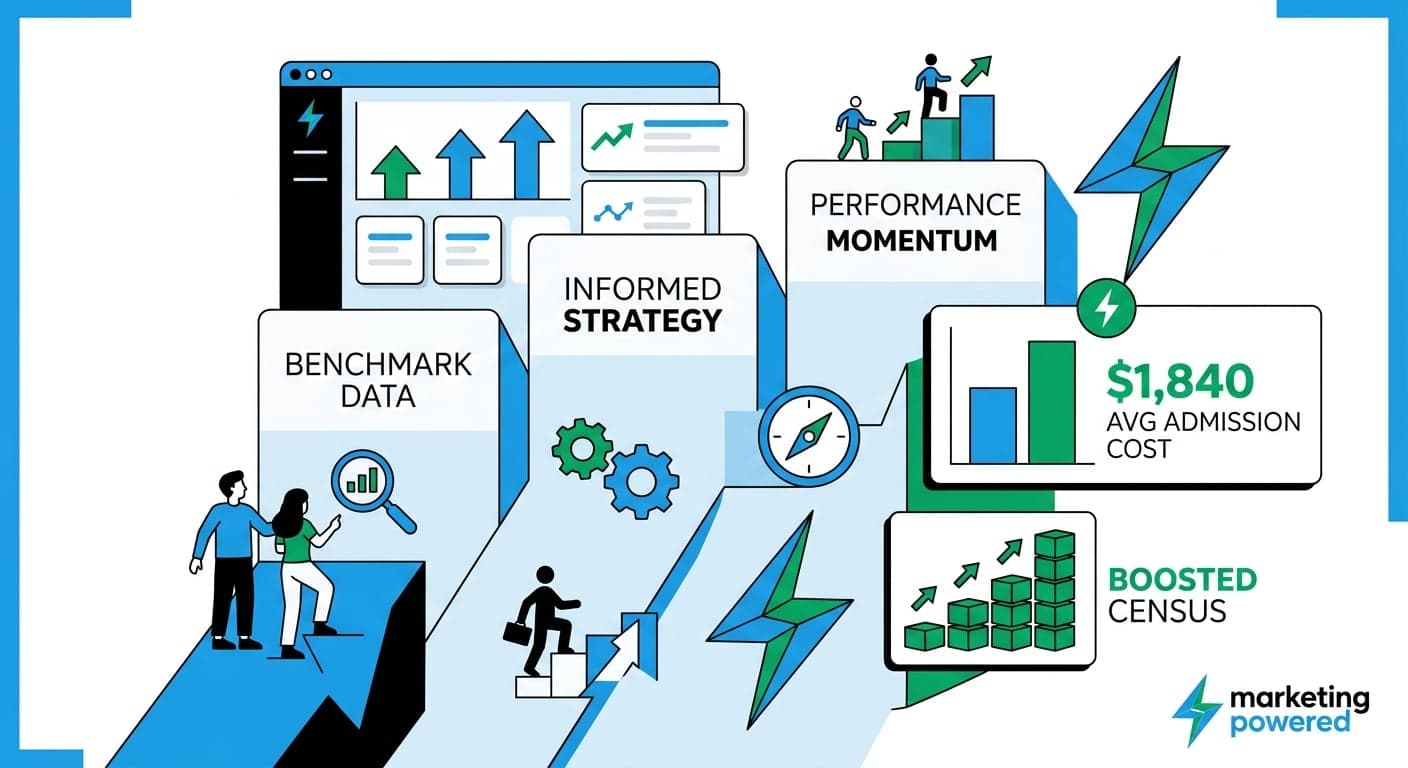
Cost per admission from Meta campaigns averaged $1,840 across our managed accounts. This figure represents the fully loaded cost to generate one admission attributed to Meta advertising. The range was $980 for IOP and PHP programs with shorter decision cycles to $3,200 for residential programs in highly competitive markets.
These cost per admission figures should be evaluated against your average revenue per admission and lifetime value. For residential treatment programs with average stays generating $25,000-$45,000 in revenue, a $1,800-$3,200 acquisition cost represents a sustainable unit economics model. For lower-revenue outpatient programs, the math requires tighter CPL targets.
- Average CPL (all lead types): $127
- CPL range by program type: $68 (outpatient) to $245 (competitive residential markets)
- Average cost per qualified lead: $312
- Lead-to-qualified rate: approximately 41%
- Average cost per admission: $1,840
- Cost per admission range: $980 (IOP/PHP) to $3,200 (competitive residential)
Performance by Campaign Objective
Lead Generation vs. Conversions vs. Awareness for treatment center Meta campaigns
Campaign objective selection has a direct impact on performance. We tested Lead Generation, Conversions to website, and Awareness objectives across comparable audiences and budgets.
Lead Generation campaigns using Meta's instant forms produced the highest volume of leads at the lowest CPL at $98 average. However, lead quality was lowest, with only 31% of leads meeting qualification criteria. Many users complete instant forms without fully reading them, resulting in higher volumes of unqualified submissions.
Conversion campaigns optimizing for website form completions produced fewer leads at a higher CPL at $156 average, but significantly better quality. Qualification rates reached 52%, meaning the effective cost per qualified lead was lower despite the higher top-line CPL.
For behavioral health marketing specifically, we recommend conversion campaigns over Lead Generation for most treatment centers. The quality improvement justifies the higher per-lead cost, and your intake team's time is better spent on leads who have demonstrated enough intent to complete a website form.
Awareness campaigns should not be used as primary lead generation vehicles, but have a legitimate role in markets where your organization lacks name recognition. The measurement challenge with Awareness objectives is attribution: the impact on downstream conversion rates is real but difficult to isolate in standard reporting.
- Lead Generation (instant forms): $98 average CPL, 31% qualification rate
- Conversions (website form): $156 average CPL, 52% qualification rate
- Effective cost per qualified lead is lower with the conversions objective despite a higher CPL
- Recommendation: conversion objective for most treatment center campaigns
Comparative Insights: Facebook Ads vs. Other Platforms
How Meta advertising stacks up against Google, TikTok, and programmatic for treatment center marketing
Facebook ads benchmarks only tell part of the story. Treatment center marketing directors need to understand how Meta performance compares to other channels to make informed budget allocation decisions. The data below compares Meta against Google Ads Search and Display, TikTok, LinkedIn, and programmatic display for behavioral health campaigns.
Google Search remains the highest-intent channel for treatment center advertising. The average cost per click for behavioral health keywords on Google Search was $48.72 in 2025, drawing from our managed Google Ads accounts. This is approximately 17x higher than Meta's average CPC. However, Google Search leads convert to admission at 2.3x the rate of Meta leads, partially offsetting the cost difference.
When comparing cost per admission, Google Search averaged $2,450 versus Meta's $1,840. Meta delivered a lower cost per admission in aggregate, but the channels serve different functions in the funnel. Google Search captures active searchers with immediate intent. Meta builds awareness and captures demand earlier in the consideration process.
TikTok advertising for behavioral health showed promising CPM efficiency at $8.40 average but struggled with lead quality. The platform's younger demographic and entertainment-first context produced high impression volume at low cost, but conversion rates lagged significantly. Cost per qualified lead on TikTok was $487, making it currently unsuitable as a primary lead generation channel for most treatment centers.
LinkedIn produced the highest CPMs at $62.40 and CPCs at $11.80 of any social platform. For B2B-oriented behavioral health services, including employer assistance programs and referral development with healthcare providers, LinkedIn's targeting precision can justify the premium. We do not recommend LinkedIn for direct-to-consumer treatment center advertising.
Programmatic display through demand-side platforms offered broad reach at moderate CPMs at $12.30 but faced significant brand safety and placement quality concerns in the healthcare vertical. The compliance risk often outweighs the cost efficiency for organizations operating under HIPAA requirements.
- Meta: $1,840 average cost per admission, $2.84 CPC
- Google Search: $2,450 average cost per admission, $48.72 CPC
- TikTok: $8.40 CPM but $487 cost per qualified lead
- LinkedIn: $62.40 CPM, best for B2B referral development only
- Programmatic display: $12.30 CPM with brand safety and compliance concerns
Email Us
Prefer to talk it through over email?
Impact of Behavioral Health Restrictions on Meta Ads Metrics
Why treatment center advertising performs differently than other verticals on Meta
Behavioral health meta ads benchmarks diverge from general industry benchmarks for structural reasons. Understanding these differences helps marketing directors set appropriate expectations and avoid misdiagnosing campaign performance against irrelevant comparison points.
Meta prohibits retargeting based on health conditions and limits certain audience targeting options under its sensitive health advertising policies. Standard Meta advertising strategy relies heavily on retargeting website visitors and engaged users. E-commerce advertisers routinely see 3-5x higher conversion rates from retargeting audiences compared to prospecting. This option is not available for behavioral health.
The inability to retarget means behavioral health campaigns must work harder at the prospecting level. Every impression needs to drive immediate action because you cannot follow up with users who showed interest but did not convert. This constraint increases effective CPL compared to unrestricted verticals and places greater emphasis on landing page conversion optimization and immediate call-to-action clarity.
Meta has progressively restricted health-related interest targeting options. Categories like addiction recovery or mental health awareness that were previously available for targeting have been removed or restricted. This pushes behavioral health advertisers toward broader targeting approaches that rely on creative to qualify audiences rather than targeting parameters.
The shift to broad targeting with algorithmic optimization has actually improved performance for some behavioral health advertisers. Meta's machine learning can identify converting users from broad audiences more efficiently than manual interest stacking, particularly when fed sufficient conversion data. However, campaigns need 50 or more conversions per week per ad set to exit the learning phase and optimize effectively.
Compliance overhead also affects creative velocity. Behavioral health advertising requires careful attention to ad copy and creative compliance. Claims must be accurate. Testimonials require proper framing. Before and after imagery is restricted. These constraints slow creative testing velocity compared to unrestricted verticals, meaning optimization takes longer and the compound gains from rapid iteration are harder to achieve.
Seasonality and Demand Fluctuation in Behavioral Health Meta Advertising
How treatment demand cycles affect Meta ads performance throughout the year
Behavioral health search demand shows significant seasonality. Treatment inquiries peak in January due to the post-holiday intervention effect, show secondary peaks around major holidays, and dip during summer months. This seasonality affects Meta's advertising performance throughout the year.
January CPLs are typically 15-25% lower than annual averages due to higher demand meeting a stable supply of ad inventory. Summer months see CPLs 20-30% above average as demand drops while advertiser competition remains relatively constant.
Smart budget allocation follows demand patterns. Increasing Meta spend in Q1 and Q4 while moderating in Q2 and Q3 produces better annual cost efficiency than flat monthly budgets. However, this requires planning and flexibility that not all treatment center marketing operations can accommodate.
Dual diagnosis programs face unique challenges on Meta due to the complexity of communicating co-occurring disorder treatment in an ad creative. CPLs for dual diagnosis campaigns averaged 18% higher than general addiction treatment campaigns.
Adolescent treatment programs showed lower CPLs at $98 average but longer decision cycles, as parents typically research more extensively before committing to treatment for a minor. The time from first click to admission averaged 23 days for adolescent programs versus 8 days for adult residential.
Detox-specific campaigns produced the lowest CPLs at $72 average and shortest decision cycles of 3-5 days, reflecting the urgency of acute withdrawal situations. However, detox-only inquiries often have lower lifetime value than residential program admissions, so the apparently superior CPL should be evaluated against revenue impact.
- January CPL: 15-25% below annual average (peak demand period)
- Summer CPL: 20-30% above annual average (demand trough)
- Dual diagnosis CPL: 18% above the general addiction treatment average
- Adolescent program CPL: $98 average, 23-day average decision cycle
- Detox program CPL: $72 average, 3-5 day decision cycle
- Adult residential average decision cycle: 8 days from first click
Free Audit
Want a straight read on where your budget is leaking?
Practical Strategy Recommendations Based on These Benchmarks
How to apply meta ads cpa benchmarks to your treatment center's advertising strategy
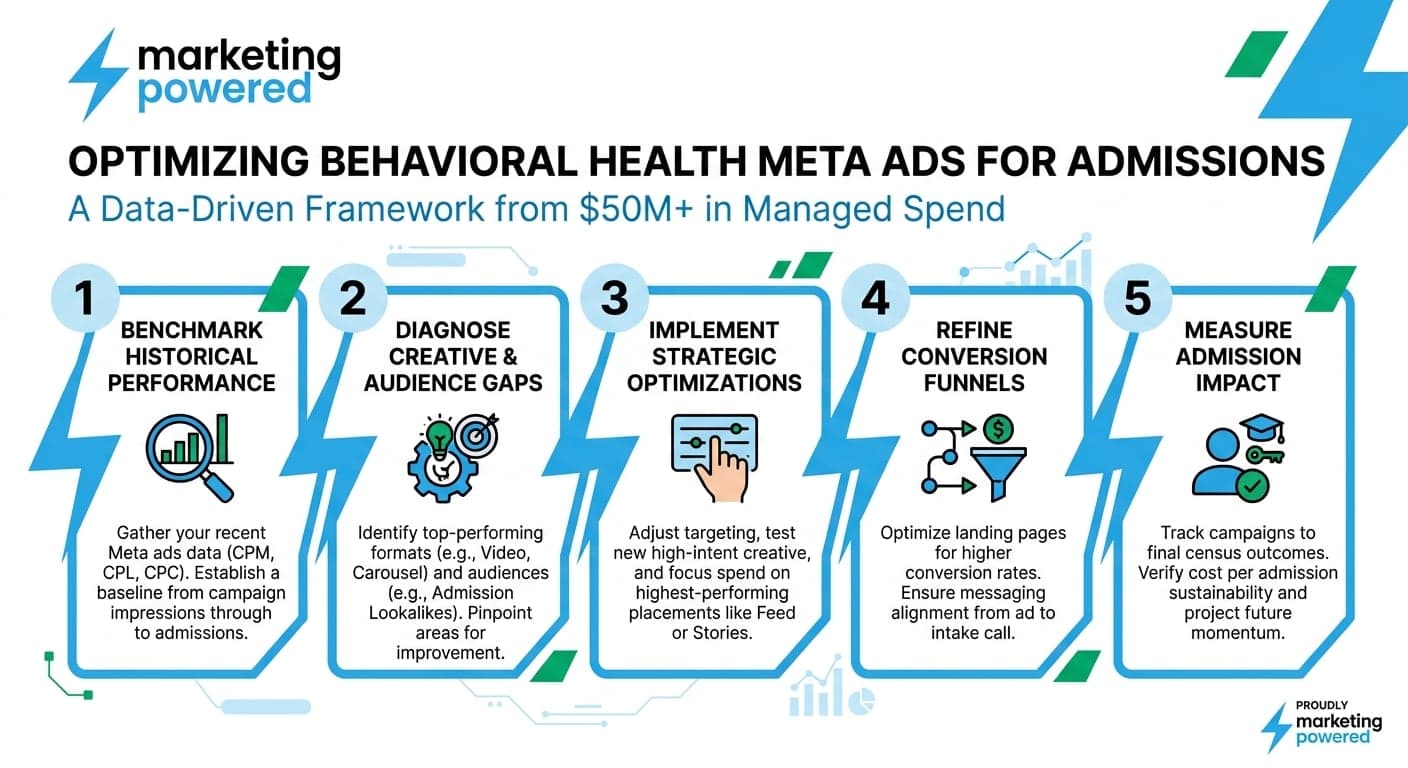
Benchmark data is only valuable if it informs action. The following recommendations translate the data presented in this study into practical strategy adjustments for behavioral health marketers.
Establish your baseline before comparing your performance to these benchmarks. Ensure you are measuring the same metrics in the same way. Use a 7-day click, 1-day view attribution window for lead generation campaigns. Count all lead events but segment quality in your CRM. Track through to admission in your intake system. The connection between Meta ad spend and actual admissions requires CRM integration and intake team discipline.
If your campaigns show CPL significantly above $127 or cost per admission above $1,840, systematic diagnosis is required. High CPM with normal CTR indicates audience saturation or creative fatigue. Normal CPM with low CTR indicates creative relevance issues. Normal CTR with high CPL indicates landing page problems. Normal CPL with high cost per admission indicates lead quality issues requiring deeper analysis of audience targeting, qualification criteria, and intake process.
Budget allocation should reflect platform strengths. Under $30,000 per month, concentrate 70-80% of the budget on Meta with the remaining budget on Google Search for highest-intent keywords only. Between $30,000 and $75,000 per month, allocate 50-60% to Meta and 30-40% to Google Search with 10% for testing. Above $75,000 per month, diversify across Meta at 40-50%, Google Search at 35-45%, and a test allocation of 10-15% for emerging channels.
Creative strategy for 2026 should follow a tiered testing approach. Use static images for initial concept testing, carousel ads for winning concepts, and video production for validated high-performers. This prevents wasting video production budget on concepts that do not resonate while ensuring your best-performing messages get the format treatment that maximizes their reach.
Audience strategy should shift toward broad targeting with creative-based qualification. Lead with a qualification in your creative by making it clear who your treatment is for. Build lookalike audiences from your best outcomes rather than all leads. Use exclusion audiences aggressively to prevent wasted spend on current patients, past unqualified leads, and staff.
Methodology and Data Sources
How this meta ads benchmark study was conducted
The meta ads benchmarks presented in this study are derived from campaigns managed by Marketing Powered between January 2025 and March 2026. The dataset includes campaign data from 47 behavioral health organizations across addiction treatment, detox, residential, IOP/PHP, dual diagnosis, adolescent treatment, and mental health verticals.
Combined media spend analyzed was $12.3M during the study period, representing a subset of our total managed spend focused on Meta platforms. Attribution data tracks leads from ad impression through the intake process to admission, using a combination of platform conversion tracking, CRM integration, and call tracking.
Geographic coverage spans 38 states, with concentration in high-volume treatment markets including California, Florida, Texas, Arizona, Illinois, Pennsylvania, New York, and New Jersey.
All data has been aggregated and anonymized. No individual client performance is disclosed. Benchmarks represent medians unless otherwise noted, to reduce the influence of outliers.
External benchmark comparisons reference publicly available data from WordStream, Statista, Meta investor reports, and government public health sources. These sources are cited in-line where referenced throughout this study.
This study will be updated annually. The meta advertising benchmarks from this 2026 edition should be considered valid for campaign planning through Q4 2026. Market conditions, platform changes, and competitive dynamics will produce different benchmarks in future periods.
Strategy
Ready to map a growth plan built for your vertical?
Compare Your Meta Performance to These Benchmarks
If your behavioral health Meta campaigns are underperforming these benchmarks, or if you want validation that your current performance is on track, we can help. Request a Meta Ads Audit to receive a detailed analysis of your campaign structure, creative performance, and cost efficiency compared to the benchmark data in this study. The conversation covers strategy, compliance, lead quality, and channel mix.
Questions, answered.
For behavioral health advertising on Meta platforms in 2026, the primary benchmarks are: average CPM of $18.42, average CTR of 1.24%, average CPC of $2.84, average CPL of $127, and average cost per admission of $1,840. These figures reflect performance within compliant campaign structures for treatment center advertising, drawn from over $12M in managed spend during the study period.
Facebook ads deliver the most cost-effective combination of reach and lead quality for behavioral health among social platforms. Meta's average cost per admission of $1,840 compares favorably to Google Search at $2,450, though Google captures higher-intent searchers. TikTok offers lower CPMs at $8.40 but significantly higher cost per qualified lead at $487 due to lower intent and conversion rates. LinkedIn's premium pricing of $62 CPM only makes sense for B2B healthcare marketing applications like referral development.
Use these benchmarks to diagnose campaign performance issues, set realistic budget expectations, and allocate spend across channels. If your CPL exceeds $127 or the cost per admission exceeds $1,840, systematic analysis of CPM, CTR, landing page conversion, and lead quality can identify the specific bottleneck. The benchmarks also inform budget allocation: organizations spending under $30,000 per month should concentrate on Meta, while larger budgets benefit from diversification across Meta and Google Search.
Cost per admission benchmarks connect advertising spend directly to census outcomes. Without a benchmark, treatment center marketers cannot determine whether their $1,800 cost per admission represents strong performance or a problem requiring attention. The benchmark also enables board and leadership conversations about marketing ROI in terms of revenue impact rather than abstract platform metrics. A $1,840 cost per admission against a $30,000 average revenue per admission represents a clear and defensible marketing investment.
We anticipate continued CPM increases of 8-12% annually as advertiser competition grows. Platform shifts toward AI-driven optimization will likely improve conversion efficiency for advertisers with sufficient data volume while disadvantaging smaller accounts. Privacy changes and potential regulatory action on health data targeting may further restrict audience options. Treatment centers should plan for rising costs and build a first-party data infrastructure to maintain targeting effectiveness as platform restrictions evolve.
Ready to see what AI-native marketing can do for your treatment center?
Request a free audit of your paid media, landing pages, attribution, and compliance posture. You'll get a straight assessment of where the opportunities are.
or email us at info@marketingpowered.ai